
PM Skills Marketplace: The AI Operating System for Better Product Decisions
68 PM skills and 42 chained workflows across 9 plugins. Claude Code, Cowork, and more. From discovery to strategy, execution, launch, growth, and shipping AI-built code.
Designed for Claude Code and Cowork. Skills compatible with other AI assistants.
Start Here
New idea? → /discover
Need strategic clarity? → /strategy
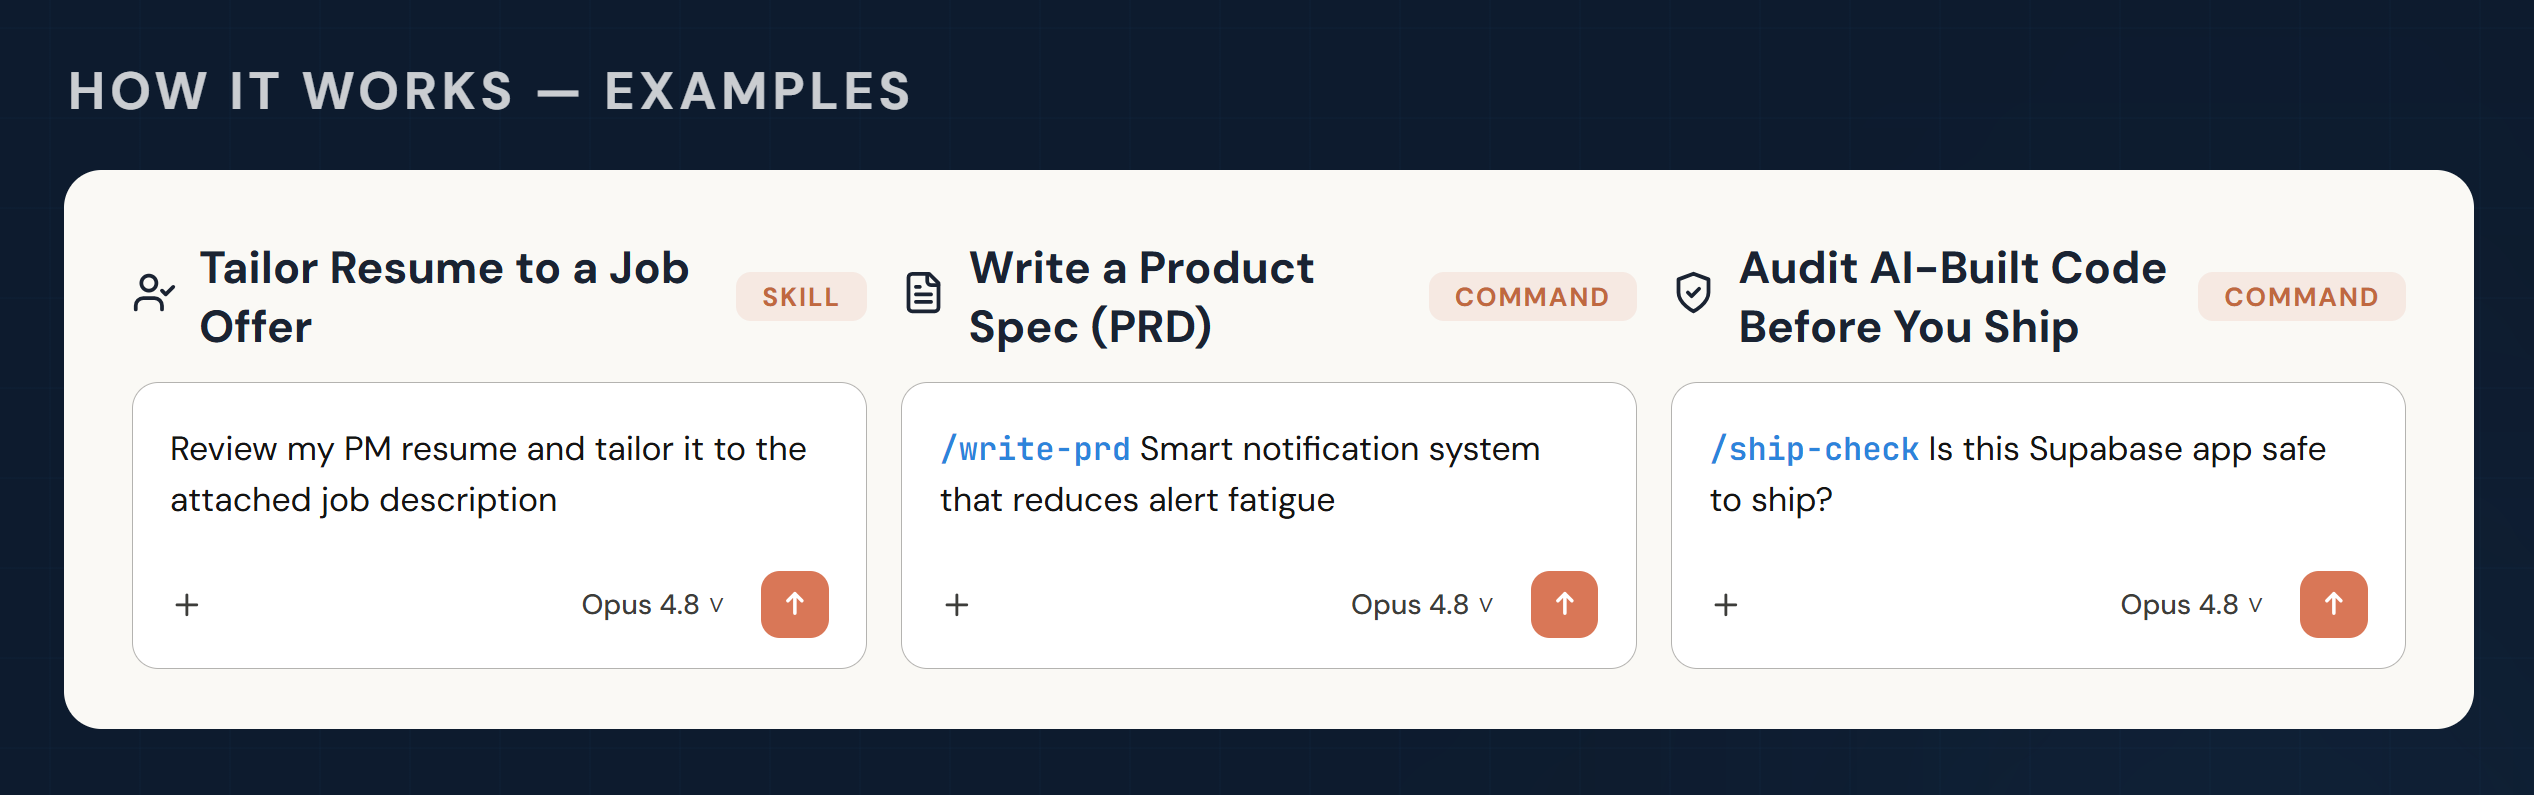
Writing a PRD? → /write-prd
Planning a launch? → /plan-launch
Defining metrics? → /north-star
If this project helps you, ⭐ the repo.
Why PM Skills Marketplace?
Generic AI gives you text. PM Skills Marketplace gives you structure.
Each skill encodes a proven PM framework — discovery, assumption mapping, prioritization, strategy — and walks you through it step by step. You get the rigor of Teresa Torres, Marty Cagan, and Alberto Savoia built into your daily workflow, not sitting on a bookshelf.
The result: better product decisions, not just faster documents.
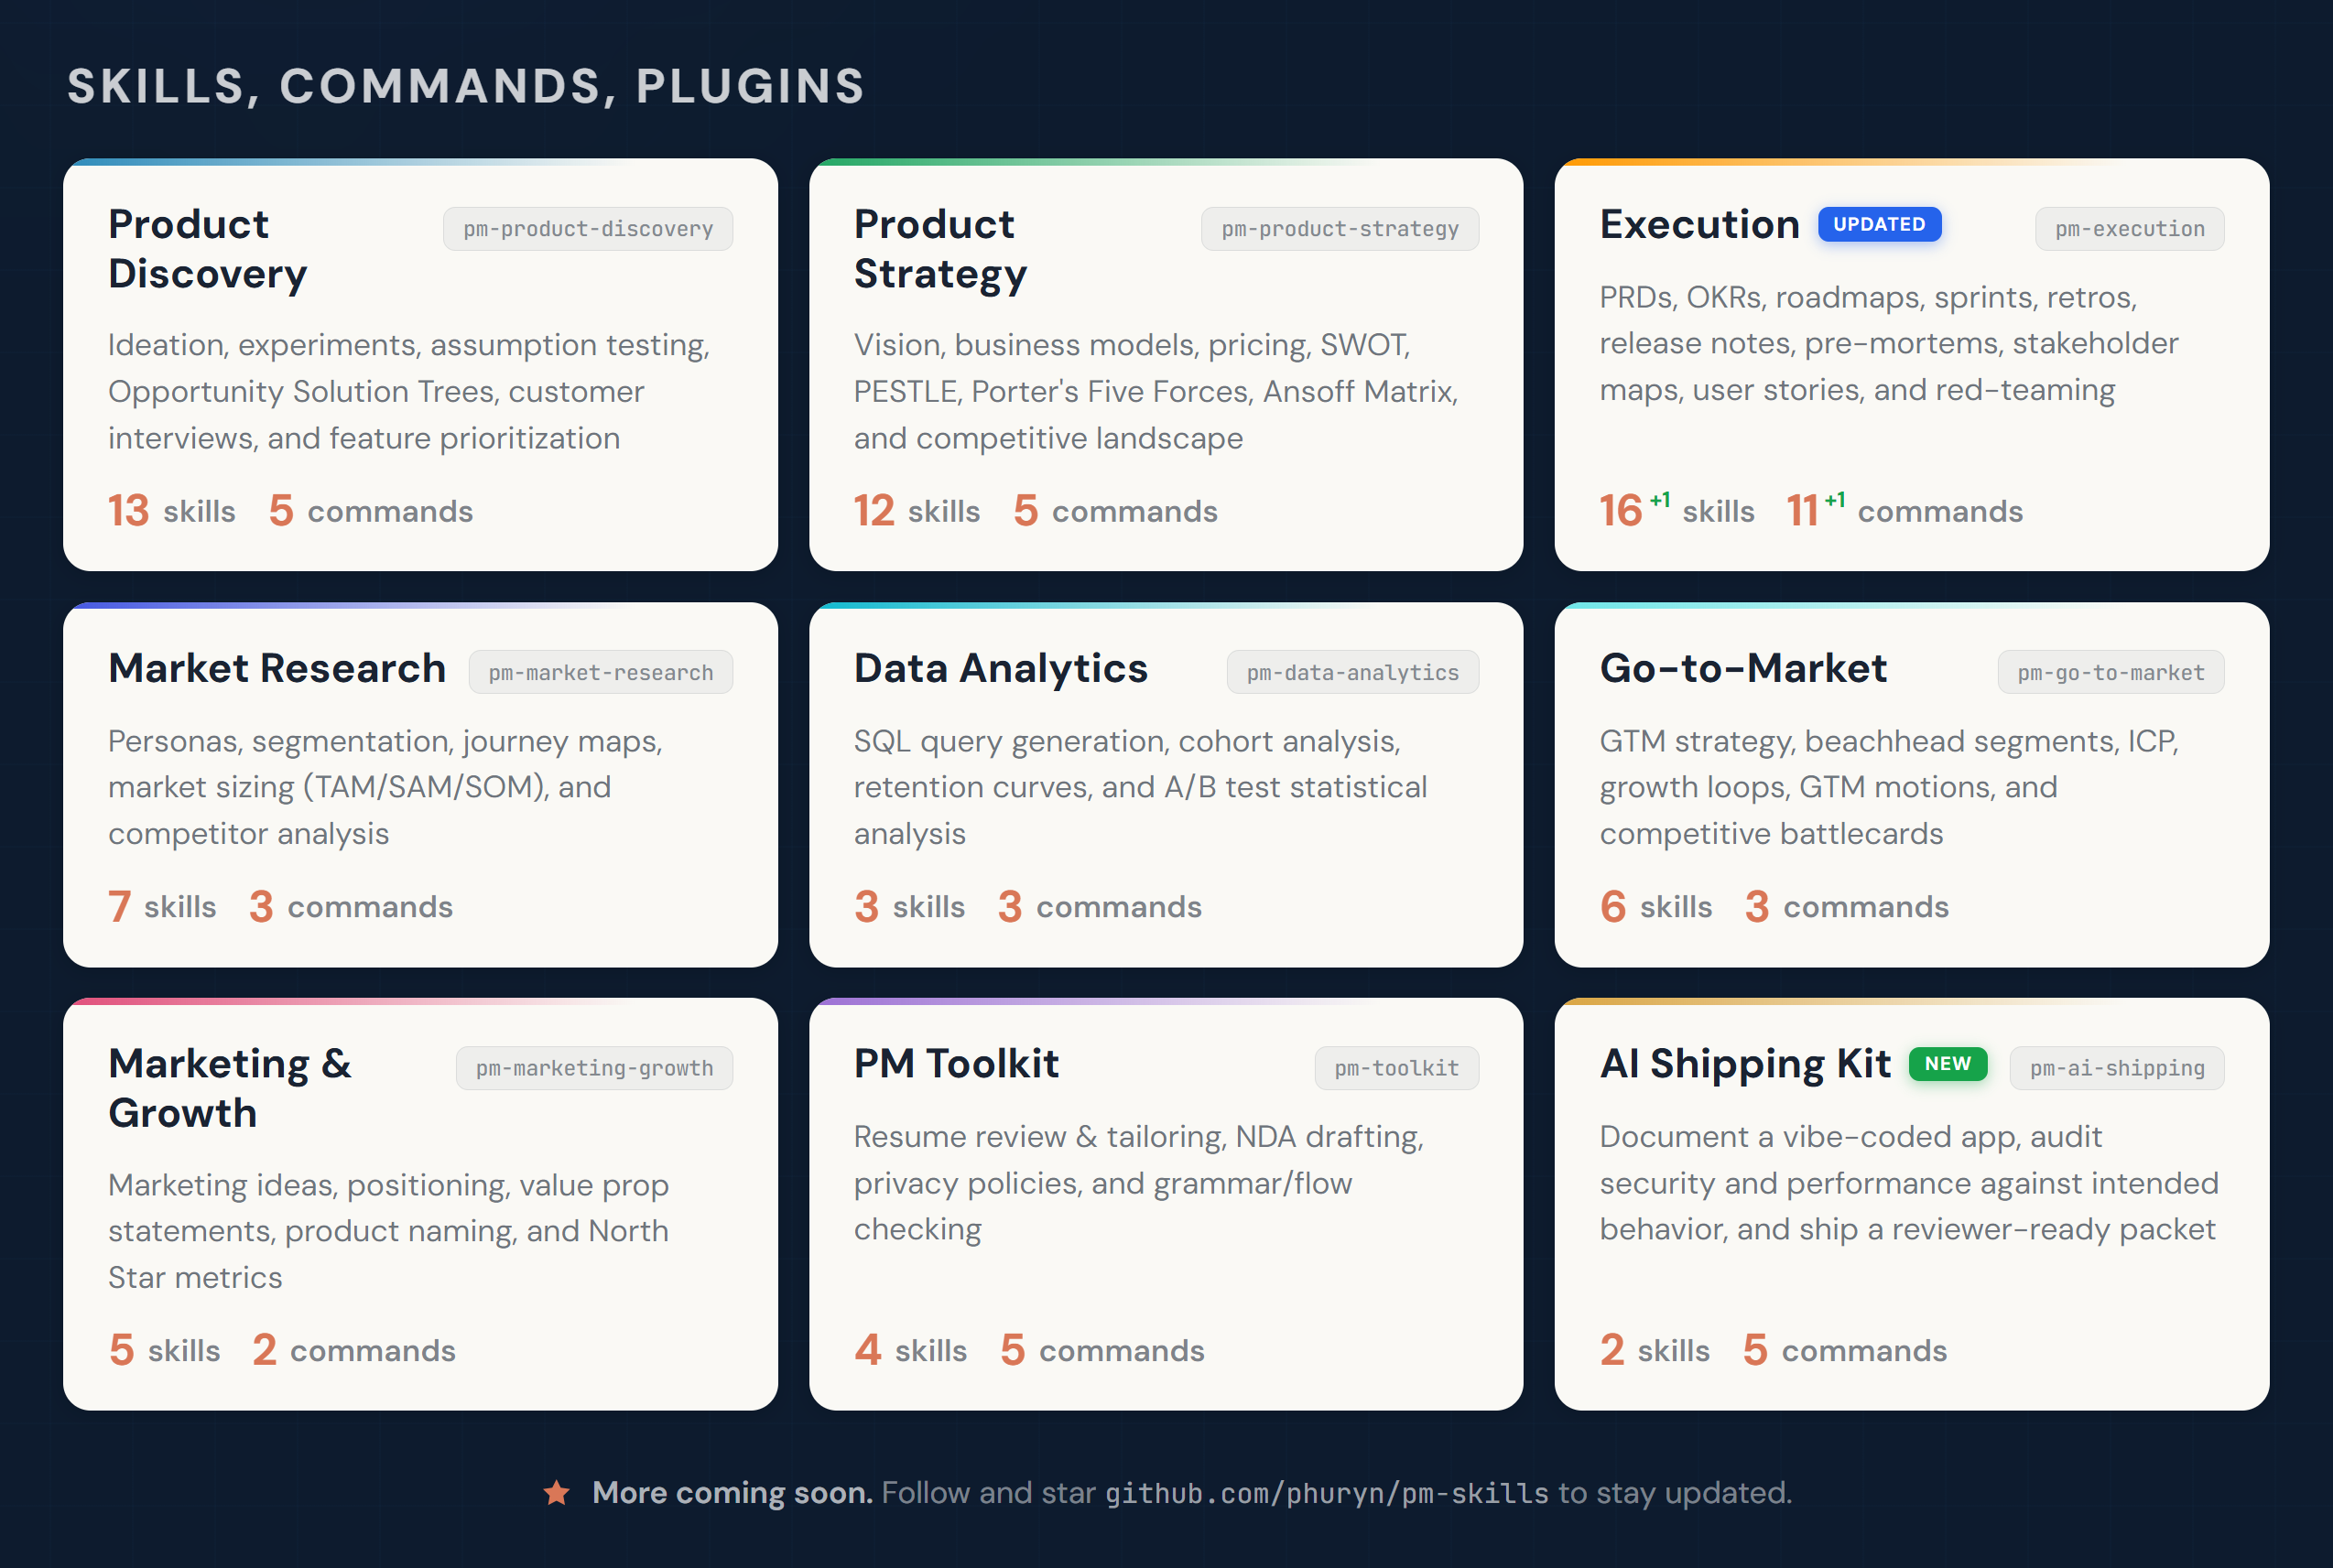
How It Works (Skills, Commands, Plugins)
Skills are the building blocks of the marketplace. Each skill gives Claude domain knowledge, analytical frameworks, or a guided workflow for a specific PM task. Some skills also work as reusable foundations that multiple commands share.
Skills are loaded automatically when relevant to the conversation — no explicit invocation needed. If needed (e.g., prioritizing skills over general knowledge), you can force loading skills with /plugin-name:skill-name or /skill-name (Claude will add the prefix).
Commands are user-triggered workflows invoked with /command-name. They chain one or more skills into an end-to-end process. For example, /discover chains four skills together: brainstorm-ideas → identify-assumptions → prioritize-assumptions → brainstorm-experiments.
Plugins group related skills and commands into installable packages. Each plugin covers a PM domain — discovery, strategy, execution, and so on. Installing the marketplace gives you all 9 plugins at once.
Commands use skills. Some skills serve multiple commands. Some skills (like prioritization-frameworks or opportunity-solution-tree) are standalone references that Claude draws on whenever relevant — no command needed.
Commands are designed to flow into each other, matching the PM workflow. After any command completes, it suggests relevant next commands — just follow the prompts.
Installation
Claude Cowork (recommended for non-developers)
- Open Customize (bottom-left)
- Go to Browse plugins → Personal → +
- Select Add marketplace from GitHub
- Enter:
phuryn/pm-skills
All 9 plugins install automatically. You get both commands (/discover, /strategy, etc.) and skills.
Claude Code (CLI)
# Step 1: Add the marketplace
claude plugin marketplace add phuryn/pm-skills

# Step 2: Install individual plugins
claude plugin install pm-toolkit@pm-skills
claude plugin install pm-product-strategy@pm-skills
claude plugin install pm-product-discovery@pm-skills
claude plugin install pm-market-research@pm-skills
claude plugin install pm-data-analytics@pm-skills
claude plugin install pm-marketing-growth@pm-skills
claude plugin install pm-go-to-market@pm-skills
claude plugin install pm-execution@pm-skills
claude plugin install pm-ai-shipping@pm-skillsCodex CLI (OpenAI)
Codex reads the same plugin marketplace file as Claude Code, so you can install PM Skills natively — no conversion or file-copying needed:
# Step 1: Add the marketplace
codex plugin marketplace add phuryn/pm-skills

# Step 2: Install the plugins you want
codex plugin add pm-toolkit@pm-skills
codex plugin add pm-product-strategy@pm-skills
codex plugin add pm-product-discovery@pm-skills
codex plugin add pm-market-research@pm-skills
codex plugin add pm-data-analytics@pm-skills
codex plugin add pm-marketing-growth@pm-skills
codex plugin add pm-go-to-market@pm-skills
codex plugin add pm-execution@pm-skills
codex plugin add pm-ai-shipping@pm-skillsWhat you get: every skill (the PM frameworks), available to Codex and invocable by name. Install whole plugins rather than cherry-picking individual skills — a workflow usually relies on several skills that ship together.
What's different from Claude Code: the /slash commands (/discover, /write-prd, …) install but don't run as Codex slash commands — Codex plugins don't expose commands. To run a workflow, just describe the steps in plain language, for example:
Run product discovery on [your idea]: brainstorm options, map assumptions, prioritize the risky ones, then design experiments — pause between each step.
Optional — let Codex turn the workflows into skills. Because the command files ship inside each installed plugin, you can ask Codex to convert the ones you use most:
Read the command files in the pm-execution plugin and create equivalent Codex skills for the workflows I use most often.
This is a best-effort, model-driven conversion (some Claude-specific command syntax won't translate), but it's a quick way to get the guided workflows on Codex without leaving the CLI.
Other AI assistants (skills only)
The skills/*/SKILL.md files follow the universal skill format and work with any tool that reads it. Commands (/slash-commands) are Claude-specific.
| Tool | How to use | What works |
|---|---|---|
| Gemini CLI | Copy skill folders to .gemini/skills/ | Skills only |
| OpenCode | Copy skill folders to .opencode/skills/ | Skills only |
| Cursor | Copy skill folders to .cursor/skills/ | Skills only |
| Kiro | Copy skill folders to .kiro/skills/ | Skills only |
# Example: copy all skills for OpenCode (project-level)
for plugin in pm-*/; do
  mkdir -p .opencode/skills/
  cp -r "$plugin/skills/"* .opencode/skills/ 2>/dev/null
done

# Example: copy all skills for Gemini CLI (global)
for plugin in pm-*/; do
  cp -r "$plugin/skills/"* ~/.gemini/skills/ 2>/dev/null
doneAvailable Plugins
<details> <summary><strong>1. pm-product-discovery</strong> — Ideation, experiments, assumption testing, OSTs, interviews (13 skills, 5 commands)</summary>Skills (13):
brainstorm-ideas-existing— Multi-perspective ideation for existing products (PM, Designer, Engineer)brainstorm-ideas-new— Ideation for new products in initial discoverybrainstorm-experiments-existing— Design experiments to test assumptions for existing productsbrainstorm-experiments-new— Design lean startup pretotypes for new products (Alberto Savoia)identify-assumptions-existing— Identify risky assumptions across Value, Usability, Viability, and Feasibilityidentify-assumptions-new— Identify risky assumptions across 8 risk categories including Go-to-Market, Strategy, and Teamprioritize-assumptions— Prioritize assumptions using an Impact × Risk matrix with experiment suggestionsprioritize-features— Prioritize a feature backlog based on impact, effort, risk, and strategic alignmentanalyze-feature-requests— Analyze and categorize customer feature requests by theme and strategic fitopportunity-solution-tree— Build an Opportunity Solution Tree (Teresa Torres) — outcome → opportunities → solutions → experimentsinterview-script— Create a structured customer interview script with JTBD probing questionssummarize-interview— Summarize an interview transcript into JTBD, satisfaction signals, and action itemsmetrics-dashboard— Design a product metrics dashboard with North Star, input metrics, and alert thresholds
Commands (5):
/discover— Full discovery cycle: ideation → assumption mapping → prioritization → experiment design/brainstorm— Multi-perspective ideation (ideas|experiments×existing|new)/triage-requests— Analyze and prioritize a batch of feature requests/interview— Prepare an interview script or summarize a transcript (prep|summarize)/setup-metrics— Design a product metrics dashboard
Examples:
Skills:
What are the riskiest assumptions for our AI writing assistant idea?Help me build an Opportunity Solution Tree for improving user activationPrioritize these 12 feature requests from our enterprise customers [attach CSV]
Commands:
/discover AI-powered meeting summarizer for remote teams/brainstorm experiments existing — We need to reduce churn in our onboarding flow/interview prep — We're interviewing enterprise buyers about their procurement workflow
Product strategy, vision, business models, pricing, and macro environment analysis. Covers the full strategic toolkit from vision crafting through competitive landscape scanning.
Skills (12):
product-strategy— Comprehensive 9-section Product Strategy Canvas (vision → defensibility)startup-canvas— Startup Canvas combining Product Strategy (9 sections) + Business Model — an alternative to BMC and Lean Canvas for new productsproduct-vision— Craft an inspiring, achievable, and emotional product visionvalue-proposition— 6-part JTBD value proposition (Who, Why, What before, How, What after, Alternatives)lean-canvas— Lean Canvas business model for startups and new productsbusiness-model— Business Model Canvas with all 9 building blocksmonetization-strategy— Brainstorm 3–5 monetization strategies with validation experimentspricing-strategy— Pricing models, competitive analysis, willingness-to-pay, and price elasticityswot-analysis— SWOT analysis with actionable recommendationspestle-analysis— Macro environment: Political, Economic, Social, Technological, Legal, Environmentalporters-five-forces— Competitive forces analysis (rivalry, suppliers, buyers, substitutes, new entrants)ansoff-matrix— Growth strategy mapping across markets and products
Commands (5):
/strategy— Create a complete 9-section Product Strategy Canvas/business-model— Explore business models (lean|full|startup|value-prop|all)/value-proposition— Design a value proposition using the 6-part JTBD template/market-scan— Macro environment analysis combining SWOT + PESTLE + Porter's + Ansoff/pricing— Design a pricing strategy with competitive analysis and experiments
Examples:
Skills:
Compare Lean Canvas vs Business Model Canvas vs Startup Canvas for my marketplace startupDesign a value proposition for our AI writing assistant targeting non-native English speakersRun a Porter's Five Forces analysis for the project management SaaS market
Commands:
/strategy B2B project management tool for agencies/business-model startup — AI writing tool for non-native English speakers- `/value-proposition SaaS onboarding tool for en
…